Snapchat Demographics and Statistics [October 2019]
![Snapchat Demographics and Statistics [October 2019]](https://www.techjunkie.com/wp-content/uploads/2018/01/electronics-gadget-internet-768332.jpg)
Snapchat is one of the world’s most popular social media apps, despite what seems like a highly counter-intuitive premise. Unlike other social networks, Snapchat was built on the idea that posts should be temporary. Instead of archiving everything people said or did forever (like Facebook), they decided to act as a daily diary written in disappearing ink. On Snapchat there is no permanent record of your thoughts and actions, outside of capturing screenshots. That disappearing-content feature made the app popular immediately, as people would post pictures that were perhaps indiscreet without having to worry that the pictures would come back to haunt them at a job interview or college admissions process.
With the popularity of Snapchat, we decided to take a detailed look into the demographics surrounding its user base. Snapchat’s general users famously skew younger than social networks like Facebook, but what about their location in the world? How much time do they spend using Snapchat? And how many photos and videos are captured using Snapchat each day? In this guide, we’re going to dive deep into who uses Snapchat, how long they use it for each day, how it compares to rival Instagram, and much, much more. Let’s get nerdy and take a look into some statistics for Snapchat.
Breaking Down the Basics
To start, we wanted to look at the core information surrounding Snapchat users, and more specifically, four basic points of a person’s characteristics: their age, their gender, their geographic location (or nationality), and their ethnicity. This is all pretty basic information, but it can also be pretty difficult to track. When you sign up for a Snapchat account, you’re only asked to give some basic information, including your name and birthday in order to ensure you’re old enough to use the platform. Of course, this information could be useful in figuring out certain statistics regarding who’s using Snapchat, but unsurprisingly, Snapchat keeps much of this information under lock and key from the general public.
Still, thanks to Snapchat’s general reporting, along with surveys from various publications, we can more or less dive into the demographic basics for Snapchat. Let’s take a look.
Age and Gender
It shouldn’t be any major surprise that Snapchat’s user base is fairly young. For much of its life, one of Snapchat’s main points in the media has been about its younger user base and how this affects them both showing advertisements and keeping users active on the platform. Omnicore’s stats round-up for Snapchat (available in our sources at the bottom of this guide) point us to some numbers that, as obvious as they might appear, still surprised us in some ways.
Supported by Omnicore and sourced from Pew Research’s excellent 2018 round-up of social platforms, 78 percent of Snapchat users are under the ages of 18 and 24. When including users aged 13 (the age minimum for the platform) to 18, however, this number increases to around 90 percent. This makes Snapchat the third most popular app among that age group, behind YouTube and Facebook, in terms of market penetration. Pew’s poll also found that only 7 percent of the platform’s user base were above the age of fifty, making it one of the youngest social user bases around the world.
In terms of gender, Snapchat’s user base swings female—or at least they did in 2013. Six years ago, Snapchat CEO Even Spiegel told investors that 70 percent of Snapchat’s users were female. While it’s impossible to say for sure that these stats hold up all these years later, what we can say for sure is that users that identify as female college students use the app to send selfies far more often than users that identify as male college students. Statistically, male college students take selfies about 50 percent of the time, while the female user base for Snapchat take selfies 77 percent of the time.
Location
Once again, we were unsurprised to learn that Snapchat’s user base is largely a global one, and although the app is popular in the United States, it’s had no major issues becoming more popular in other places throughout the world. More than 25 percent of smartphone owners in the United Kingdom have a Snapchat account, while that number rises to 50 percent in Norway. In the United States, meanwhile, 18 percent of social media users have a Snapchat account Likewise, Ireland, Saudi Arabia, and Sweden have reached the highest levels of penetration for the platform in users over the age of 16.
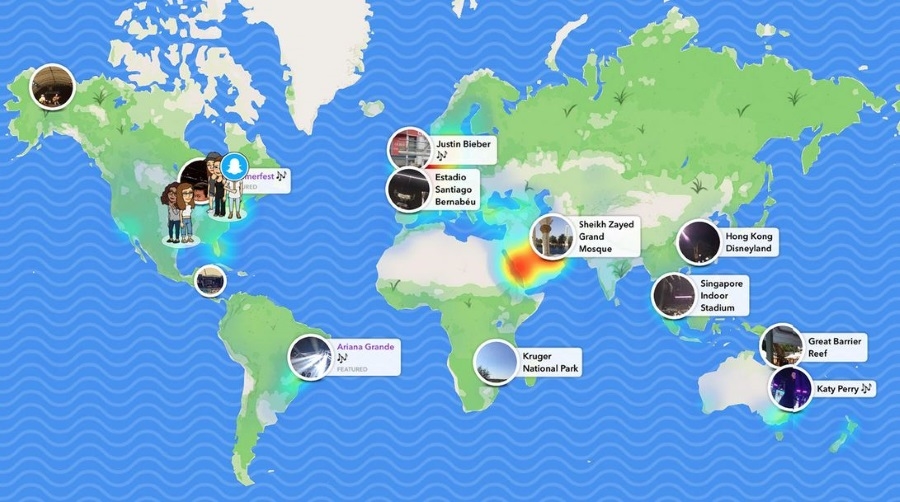
So while the United States may lead the app’s usage by a long shot, it’s certainly not an app without global reach. Along with the aforementioned United Kingdom and Saudi Arabia, France, India, Mexico, and Germany all make the list, with Brazil, Canada, and Australia following up the tail end.
Advanced Information
We’ve covered the basics about Snapchat, but now it’s time to take a look at some more advanced information about Snapchat. Instead of looking just at the demographics of users, we’re going to take a look at how often people use Snapchat, both day-to-day and in regards to their closest rival, Instagram. But first, we need to look at how people view Snaps, and whether it’s on iOS devices or Android devices.
iOS or Android
The argument of iOS vs Android on Snapchat has been a major point of contention for the company, one that has cost them millions of dollars in lost revenue. For years, Snapchat’s Android app was considered far worse than the iOS version of the app, and if you ever used them back to back, it was easy to see why. While Snapchat’s iOS app used the actual camera to take photos—essentially the same way any camera app on iOS would—Snapchat decided to circumvent the normal Camera API (and eventually the Camera 2 API) on Android and instead create literal screenshots from what was on the display. This meant you weren’t taking a full resolution photo on Snapchat, but a photo the resolution of your display, creating the appearance that Android cameras were far worse than iOS.
Outside of that, the app just wasn’t optimized. Android users reported regular battery drain when the app was open, because Snapchat ran the camera in the background constantly, whether you were on the viewfinder or not. Snapchat also launched features on iOS first, often leaving Android users in the dark for weeks or months. This hostility between Snapchat and Android users became public in 2017, when Snapchat launched its IPO and had to disclose possible challenges they would have to overcome in the future. Directly quoting from the IPO filing, Snapchat wrote “We have prioritized development of our products to operate with iOS operating systems rather than smartphones with Android operating systems.”
This prioritization came from the actual usage of Snapchat on iOS, which was reportedly far above what they were seeing on Android, and while we don’t have exact numbers, Snapchat’s reporting has said that, even two years later, this has remained the same. In 2018, Snapchat issued something of a mea culpa, announcing they’d be rebuilding the app on Android, to the thrill of Android Snapchat users everywhere. That rebuilt app took a year to roll out, and unfortunately, it doesn’t fix every issue we’ve seen on Android. While the app is certainly better with battery life, picture quality still isn’t great, with the app still capturing screenshots as opposed to native photos. (Snapchat does use the Pixel Visual Core on Google Pixel devices, which, at the very least, does allow for some post-processing on a small number of devices).

We don’t have exact numbers, but iOS use for Snapchat continues to trend much higher than the app’s numbers on Android, and considering the issues the app has seen on Google’s platform, it’s easy to see why.
Time Spent in the App
There’s some debate about just how much time is spent within Snapchat per day, but most numbers seem to indicate the app is used quite often. With 190 daily active users and more than 300 million monthly active users, the app has maintained some amount of popularity, even if growth slowed and declined in 2018. Generally speaking, the app is on something of a rebound this year. As far as the actual amount of time spent in the app, Snap Inc. reported in their Q2 2018 earnings that Snapchat users were spending, on average, more than 30 minutes a day. That’s pretty good, especially for an app where the longest form of content most people will find on the platform runs, at most, about a minute.
Though there’s a smaller amount of longer content in the form of partner stories—think things like the Washington Post or People’s original Snapchat stories—most of the content watched on Snapchat are snaps and stories made by friends. We’ll dive a bit more into that in just a moment below.
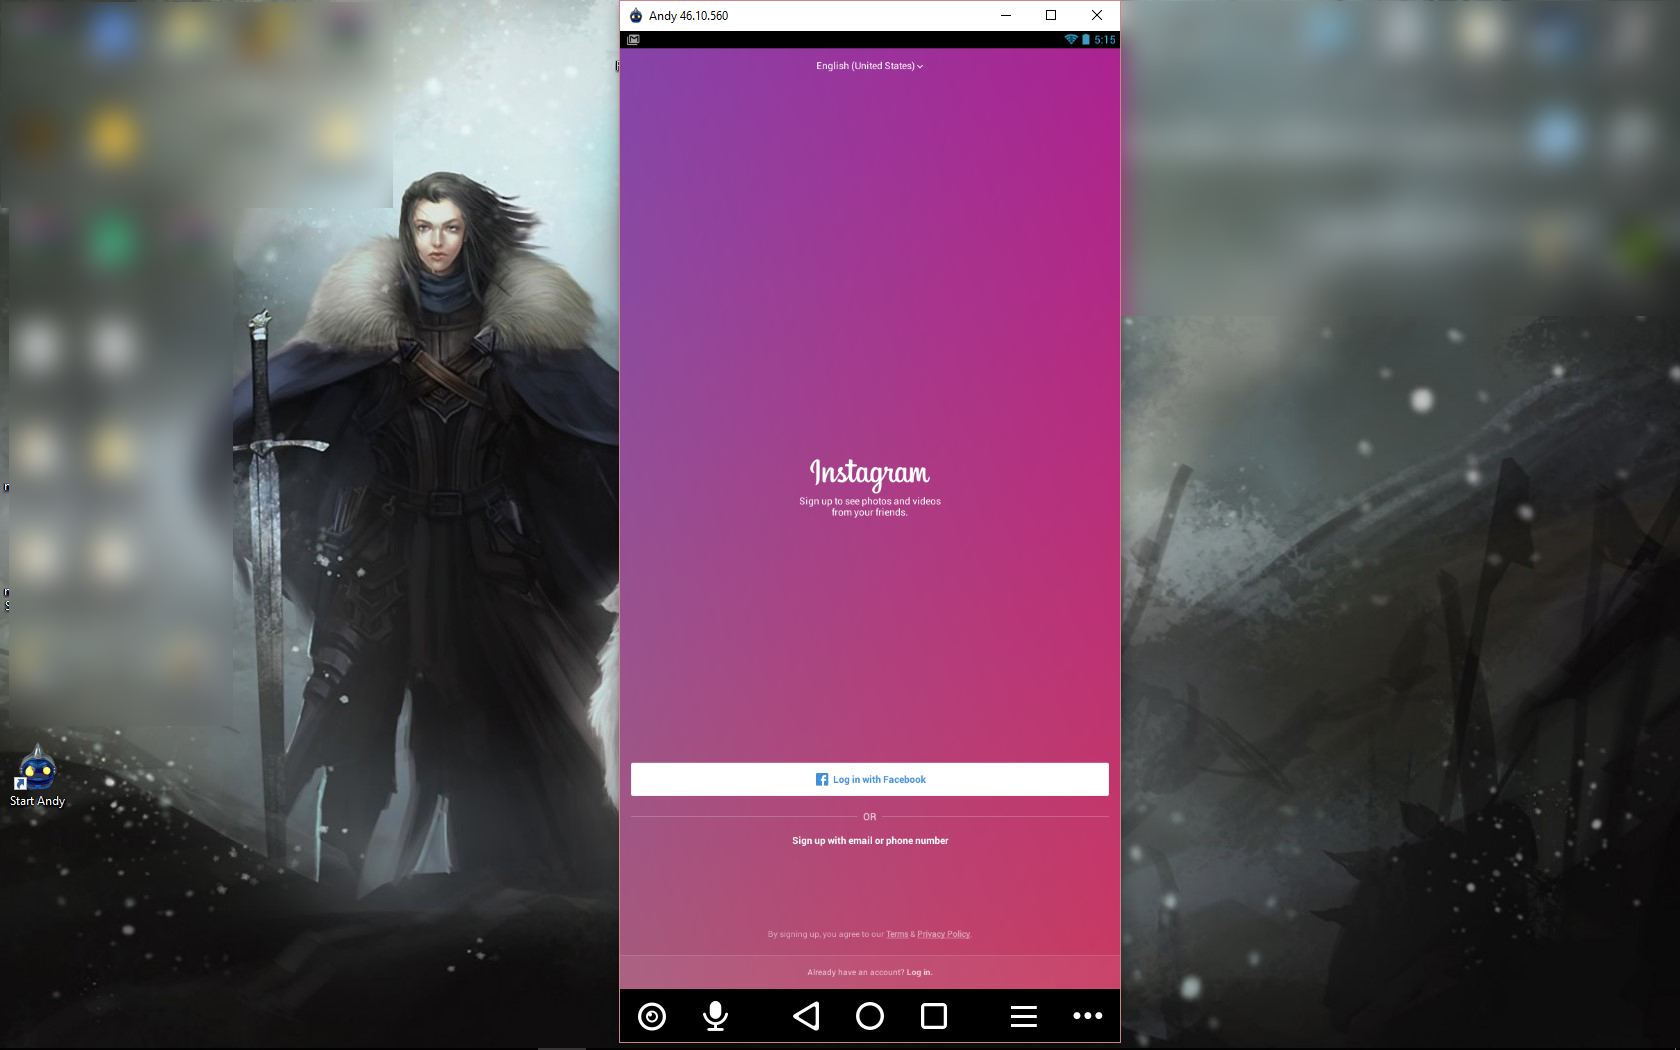
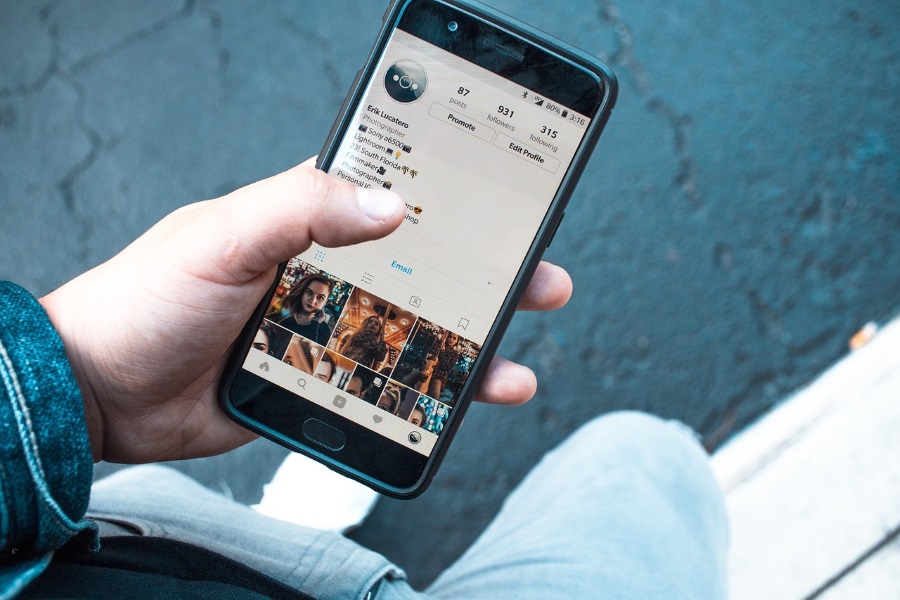
Time Spent vs Instagram
Snapchat’s closest competitor is Instagram, and so while it’s important to look at how long people spend within Snapchat, comparing it to the Facebook-owned photo sharing app is a smart idea. According to a report from Marketingland, Snapchat’s more recent average time spent has dropped to around 26 minutes at the end of May 2019, while Instagram’s own time rose to 27 minutes per day. The difference of a single minute might not seem like a lot—especially since this reporting isn’t coming directly from Snapchat or Instagram—but what the report does offer is insight into what these trends look like in the future. By 2021, we should see Snapchat steady at 26 minutes of time spent per day by each user, while Instagram is set to rise to 29 minutes per day.
Obviously whether these reports bear out remains to be seen, but regardless, Snapchat’s implied death at the hands of Instagram continue to be overstated at best. Stagnation might not be growth, but at least it isn’t dropping in numbers.
Numbers and Statistics
These time estimates are great, but even more interesting are the numbers you’ll find when you dive directly into the stats of the application. With Snapchat being such a popular app, it’s easy to wonder: how many Snaps are created and sent per day? How many stories are watched? Let’s dive into some incredibly fascinating numbers in our round-up below.
Snaps Made Per Day
If you had to guess, on average, how many snaps were being created each day, including both photos and videos, what would you guess? One million? Five hundred million? Believe it or not, you’d be way, way off base: in those same Q2 earnings we mentioned above, Snap Inc. reported more than three billion snaps are created per say, with both photos and videos being counted. Now, to be fair, it is unclear whether or not Snapchat is counting longer videos as multiple snaps when they report three billion snaps created each day (thus counting a minute-long video as six snaps), but honestly, it doesn’t really matter. Snapchat is clearly a mega-giant when it comes to user-created content.
Stories Watched Per Day
It’s tough to find exactly how many Snapchat Stories are made per day, but finding information on how many Snapchat Stories are actually watched is much easier. Our data is a few years old now, but Stories are reportedly viewed ten billion times per day. That number comes to us from 2017, which means that it’s likely only gone up since it was published. Stories are by far Snapchat’s most popular and successful feature, both from a numbers perspective and a cultural one. The feature has been imitated directly by Facebook across all its major apps, including Facebook, Instagram, Messenger and WhatsApp, with other platforms like YouTube also co-opting the feature for their own app.

It’s unclear whether this includes content from major publishers within the Discover tab on Snapchat, or if this is focused exclusively on Stories published by actual users. Regardless, Snapchat Stories remains a force to be reckoned with, even as every platform imaginable tries to take on Stories with their own versions.
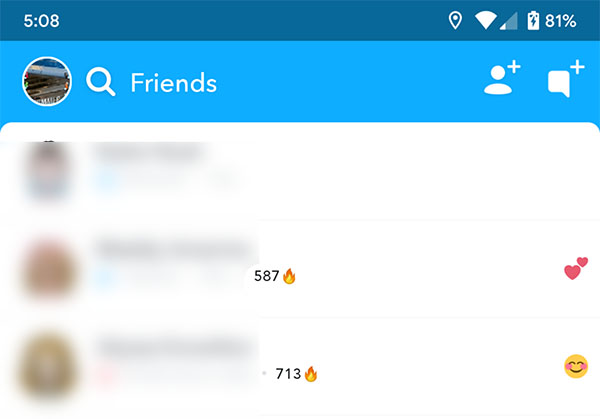
Longest Snap Streak
While most of our data is sources from Snapchat itself or from reputable third-party reporting on the subject, we can verify our own reporting on the longest Snap Streak here. The idea behind a Snapchat streak is simple: you and a friend each snap each other back once a day within twenty-four hours (though there’s some contention about this, as you’ll see below). After three days of back and forth snapping, you’ll finally receive a small flame icon, along with a new number: 3, to represent three days of snapping back and forth between users. This is your Snapchat streak, and it’ll go up every day you and the other person snap with each other.
We update our guide to the highest Snap streak every month on our full guide, but as of October 2019, our highest Snap streak comes in well above 1500, with plenty of close competitors nearing that number as well. If you want to submit your own Snap streak to our top 25, check out that article linked above and send us your score!
Sources
This data comes from a ton of sources, and each of these pages includes some data we couldn’t fit into our own report. If you’re still curious about how Snapchat fares in 2019, you’ll need to check out some of these guides, including:
-
- Pew Internet Research’s 2018 guide into social media use. This report is one of the best guides to understanding social media in the late 2010s, even if it is a year old now.
- Omnicore’s Snapchat Statistics, which pull together several sources (including our own guide to the longest Snap streak!) to provide hard numbers in an easy to read guide.
- MarketingLand’s projections for time spent on Facebook, Instagram, and Snapchat
- Business of App’s guide to Snapchat Statistics
- Zephoria’s Top 10 Most Valuable Snapchat Statistics
- The Verge’s 2017 reporting on Snapchat’s user numbers between iOS and Android
- Variety’s reporting on Snap Inc.’s Q2 2018 earnings
- Statista’s guide to understanding Snapchat’s regional distribution
***
Though Snapchat certainly stumbled with users in 2018 after a controversial (though, in our opinion, overblown) redesign, it’s clear that the app continues to have a meaningful, lasting impact on the world. While we can’t guarantee Snapchat will return to the growths the app was seeing in 2013 through 2016, Snapchat is far from dead, with a consistent user base centered around the world and new features rolling out regularly.
If you’re still interested in checking out more statistics on your favorite sites and apps, check out our guide to the demographics of Reddit here, and stay tuned to TechJunkie for more statistics on social media coming very soon.